


The Elephant Sanctuary Greenhouse Gas Inventory
As climate change accelerates, ecosystems worldwide face unprecedented pressure. The Elephant Sanctuary in Tennessee provides refuge to elephants in need. Recognizing that combating climate change is the best way to protect elephants’ long-term survival, the Sanctuary partnered with Wilmot to minimize their carbon footprint and fully integrate environmental stewardship into their conservation mission.
Overview
Rurally located in Hohenwald, Tennessee, the Sanctuary already excels in sustainability across its 23 buildings. On-site solar arrays generate 25% of their energy needs, they've achieved zero-waste status, and employee housing on the property significantly reduces commuting emissions.
Yet the Sanctuary remains committed to continuous improvement. Wilmot collected emissions data to establish a clear 2023 baseline of 504 metric tons CO2e—creating a foundation from which the Sanctuary can follow a roadmap toward further carbon reductions and environmental leadership. To calculate the baseline and create a targeted emissions management plan, Wilmot:
Performed facility audits documenting equipment specifications
Delivered an analysis that included:
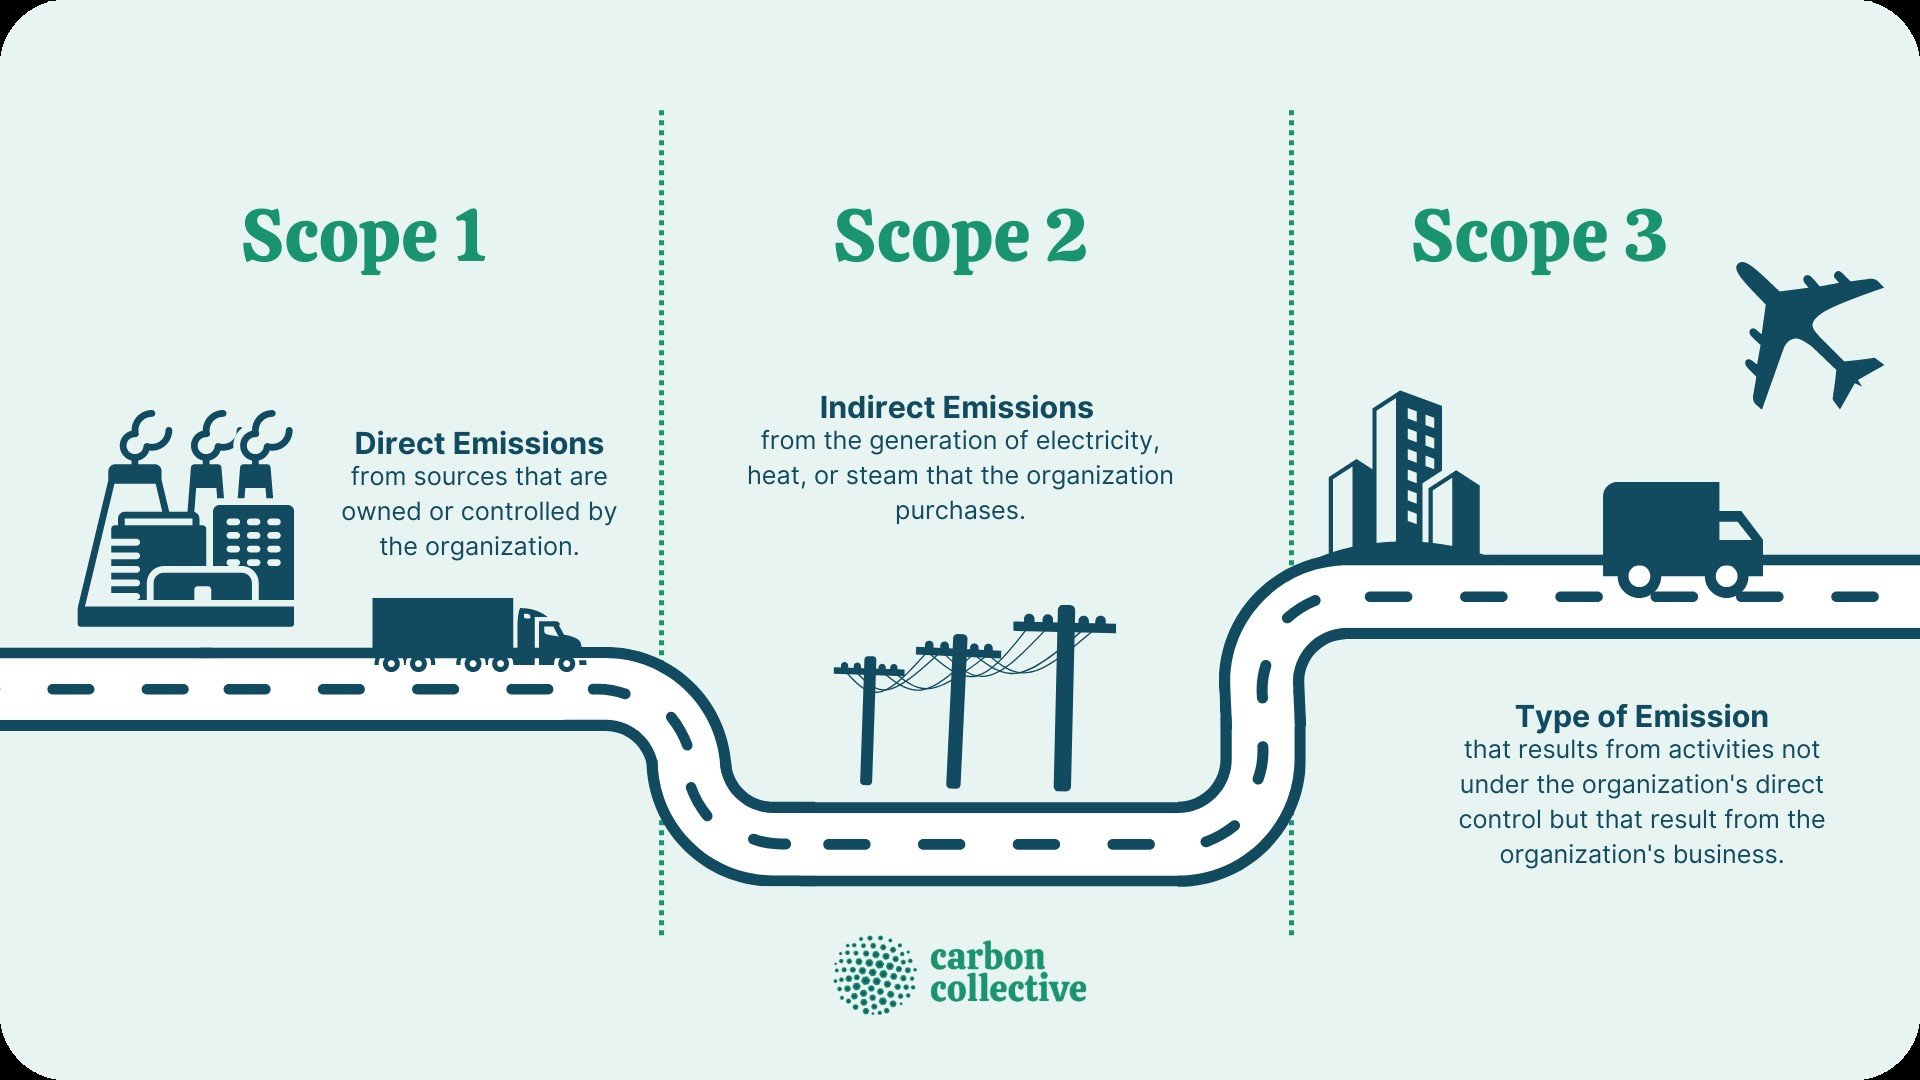
Complete emissions inventory covering Scope 1, 2, and 3 emissions
Visual data presentations highlighting key findings and trends
Reduction recommendations focusing on high-impact areas, including carbon sequestration through land management, energy-efficient facility upgrades, and employee transportation solutions
Wilmot’s Role
Results
The Sanctuary produced 504 metric tons CO2e in 2023
Employee commuting is the highest source of emissions, at 21%
Electricity and waste follow at 20% and 18%

Location
Nashville, TN
Markets
Wildlife Conservation
Services
Greenhouse Gas Inventory and Management Plan